An opening question: Are most mechanical task resolutions in D&D (attacks, spells, skills, saves, etc.) simulating an act of
intensity or one of
accuracy? That is, it more important to "go big" or to "be right"? I will argue for the latter.
This has implications for the statistics (probability distribution) we might use for our underlying task-resolution mechanic (built into any tables, for instance). Many probability distributions can be described as
"location-scale families", in that they have exactly 2 parameters -- one indicating the position (mean), and one for the likely spread around that center (variance). Perhaps it's important to think really carefully about which of these 2 parameters should be affected by increasing levels/skill/abilities/etc, and what that implies for our probability distributions.
Intensity Versus AccuracyAgain with the initial question: Are most mechanical resolutions in D&D (attacks, spells, skills, saves, etc.) simulating an act of
intensity or one of
accuracy? Let's consider some examples.
Melee attacks: More important to hit "hard" (in any random place) or to hit "right" (on the enemy, in a vulnerable spot)? I would argue the latter; slipping past the enemy's shield/armor/defenses/dodging is the key. This is reflected in increasing the attack bonus with level; the character is getting more skilled and accurate, not swinging harder and harder. (Obviously using the Strength bonus to-hit indicates there is
some intensity that is important, perhaps smashing through a shield, etc., but I think it's a minority part of the task).
What about missile attacks? Obviously a case of
accuracy -- the missile has to be shot in the right location, and no amount of special "ferocity" on the part of the shooter will help. What about casting spells? In classic D&D, again a case of
accuracy -- "The energy flow is not from the caster
per se, it is from the utterance of the sounds, each of which is charged with energy which is loosed when the proper formula and/or ritual is completed with their utterance" [Gygax in 1E AD&D DMG, p. 40]. It is the "proper formula" which is important, and a particularly bombastic rendition of it by the caster will not help things.
What about traditional thief skills? Open locks, remove traps, move silently, etc. -- Obviously these are all things that require carefulness and dexterity. Being too far left or too far right would equally result in failure; smashing tools into the lock harder than anyone else does not help.
What about expanded skills (non-weapon proficiencies)? Looking at the 3E skill list as an example, practically all of them seem to be more
accuracy based than
intensity based -- the ability to appraise, craft, disable devices, forgeries, intuit direction, knowledge, perform, search, speak languages, tumble, etc. -- there's a "right" and balanced way (to name another such skill) to do these things that would be the goal of any practitioner.
Perhaps the only exceptions I can see are Strength-based items: Maybe climb, jump, and swim would benefit from an exceptional "burst" of effort. Perhaps, more generally, any raw application of an ability score would qualify as seeking special
intensity -- like Olympic-style events of running, lifting, throwing for distance. But even with these some would argue that there is a "correct form" that is more important than anyone's raw Strength.
Thus, speaking generally, I think that for the great majority of tasks simulated in a D&D-like RPG succeed based on
accuracy (landing in the "right place"), and not on
intensity (sheer power/ distance). For most stuff, doing it doubly-hard would be a disaster, not a benefit.
Mean Versus VarianceSo, granted that for most tasks it is
accuracy that is key (having a "correct" place to be and landing there), does that mean that the important consideration is
location or
scale? Or in other words, is it the
mean or the
variance of results that is most affected by increasing skill level?
Here's an example that I use in my statistics class: Consider two basketball players, each taking three shots at the hoop. The positions of the three shots are shown for each below.

Notice: They're both aiming at the same spot -- If you average the positions of the three shots, the result is "5" for each player (that being indeed within the rim); which is to say that the
mean (central location) is the same. But which player's shots are bunched up closer together; that is, have less
variance (spread)? It's Player B. And which player has more shots going in the hoop? Again, Player B. (2 shots in to Player A's 1 shot.)
So we can see that it's really
variance which dictates
accuracy. Assuming that you're aiming anywhere near the target in the first place, then increasing your accuracy is really a matter of
reducing variance. (Or technically: accuracy and variance are inversely related.) Which is to say, your training and skill acquisition are making the result more predictable, and closer to the "right" result, more of the time.
Again, throwing the ball extra super-hard and getting, say, a +15 bonus on your shot position (mean location) would be ruinous; every shot would miss wildly, for every player.
As an aside -- You see the same observation in
modern portfolio theory -- granted that you've picked a particular target return rate, the real work then is to "reduce the total variance of the portfolio return" [Wikipedia], i.e., make the return as predictable as possible. (And that's done through diversification, i.e., increasing
sample size, which reduces variance.) And if you watch some cable TV high-stakes poker shows, for really enormous pots you'll usually see the pros "run it twice" (or more) for the exact same reason.
Modeling with a Normal CurveFor a variety of good reasons, mechanical and muscular variance (i.e., "error") is most frequently modeled with a
normal distribution (i.e., Gaussian; the z-curve; bell-shaped). As one example, see this abstract on
"Analysis of Small-bore Shooting Scores":
For a competitor with a given average score, a calculation model based on the central circular bivariate normal distribution has been used to calculate the expected distribution of the displacements of shots from the point of aim, and hence the expected variation in the competitor's scores... [Journal of the Royal Statistical Society. Series C (Applied Statistics), Vol. 21, No. 3, p. 292]

For our purpose here, results off on the tail of the normal curve are
not good (whether too far left or too far right). Our "target" is that central position (mean), like the center of a basketball hoop, or an archery target. So, we can draw a zone where our attempts count as being "on target"; the area of that zone reflects our probability of success. Increasing skill will reduce the spread/variance, narrowing the curve of possible results, and thereby getting more shots/attempts in the "target zone". Specifically, the probability of a hit/success is given by the common technique of a standardized table of areas for the normal curve (or alternatively: software like Excel or any spreadsheet program; or maybe you can do complex numerical integration in your head).

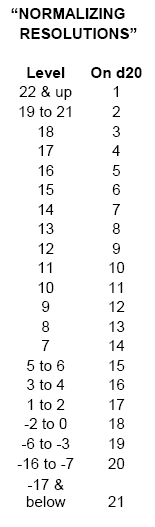
Here's an example of what we might try: Say that any result within z-score +/-2 on the normal curve counts as being "on target". At the top, for what we'll call "success level" 20, assume the standard deviation (square root of variance) is simply 1. Say we increase that error/variation by +12% (multiplying 1.12) for each step to a lower level. Then we can use a spreadsheet to easily calculate the probability at each level of landing "on target", and translate that to success target on a d20. (The previous graph shows the curve/success shape at the 10th level, in fact.)
Observations: This probability distribution has many very nice qualities. First of all, the numbers throughout levels 1-20 are broadly similar to the OD&D numbers for success at hitting AC0, or making a save vs. spells, or succeeding at a thief skill. Secondly, the numbers are "smooth", in that they don't jump at coarse increments. Thirdly, throughout the "meat" of our level progression (7th-18th), the numbers conveniently increase by 1 per level (see
"The 5% Principle"). Fourth, at the bottom, we don't have the problem of very abruptly switching from possible to impossible: an advancement beyond AD&D's 6 repeated 20's, here we see an even "softer landing": 2 copies each of 15-17; 3 18's; 4 19's; and a long string of 10 20's, before success is effectively impossible. All of these desirable features automatically pop out for us by using the right model to reflect known physical systems of success and failure.
To use this, now we really would need to commit to using the resolution table all the time. (The results are not linear as with classic D&D/ d20 System/ Target 20, so there's no simple arithmetic shortcut to the procedure.) For attacks, take the character's "fighting level", add in the opponent's AC (classic descending), plus any other bonuses or modifiers; then find that "level" in the table, and look across to see what roll of d20 counts as success. Saving throws, thief abilities, special skills, etc., can all work in a similar fashion. In other words, all modifiers must be made to the "level" value (equivalent to moving up or down rows in the table); no modifiers are ever (EVER!) applied to the resulting "to hit" score.
Can I Accomplish The Same Thing By Rolling Many Dice?No! Although it's a common mechanic to roll several dice and add them (generating a bell-shaped-like probability distribution), if you do this and compare to a minimum target number, then you're actually doing the exact
opposite of our procedure.

Compare the graph above to the one on the right; in this proposed process, it is the dice results (not success results) which are bell-shaped. The target is not the in the "center", instead it is all the extremely high results out in the tail. Bonuses and modifiers (regardless of whether we apply them to the dice roll or the target number) will now shift the
mean/center location, when our argument all along has been that we need to keep that fixed and alter the
variance, or the spread of the curve.

Quick example: Say you roll 3d6 (range 3-18) for your resolution mechanic, and see the table to the right. Note that for our "normal resolution" process, the flattest spot was in the middle (levels 7-18), where every step was consistently a 1-in-20 difference in success; but here the opposite is true -- the very center is actually where the wildest fluctuations occur (a single step around target 8-14 changes success by the equivalent 2 or 3-in-20). The more dice you add, the spikier the distribution gets, so the more this disturbing effect will be exacerbated. And you certainly don't get the long "soft landing" effect of many 20's as shown in the AD&D DMG.
Conclusions
In summary, for almost any kind of skill you can think of (hitting/ shooting/ dodging/ picking locks, etc.) character level shouldn't change the
mean result (i.e., the target); it should change the
variance of the result (i.e., get closer to the desired target, reflecting increased accuracy). And, the standard normal (bell-shaped) curve would be an excellent choice for use as a model of "error level".
A summary table (without the normal-curve statistics on display) is shown to the right. An Excel spreadsheet of the original calculations is
here if you want to confirm or play with the numbers involved.
Would I use this myself? Actually, I don't expect to. I like the Target 20 freedom from tablature (saving table space) and honestly, the results are "close enough" in the key central part of the chart (level 1-20) that it's approximately correct most of the time anyway. I might, however, use this in the future as a basis to analyze (for example) archery ranges; but if you use it in a game yourself, be sure to tell me how it went!